Inspection Step-by-step – case study
- On the basis of a previous agreement with the client, we will specify a date of inspection. If the climatic conditions are fulfilled, we will carry out an on-site inspection of the photovoltaic plant.
- Check weather conditions:
- more than 600 W/m² solar power
- less than 6 m/s wind due to panel surface cooling
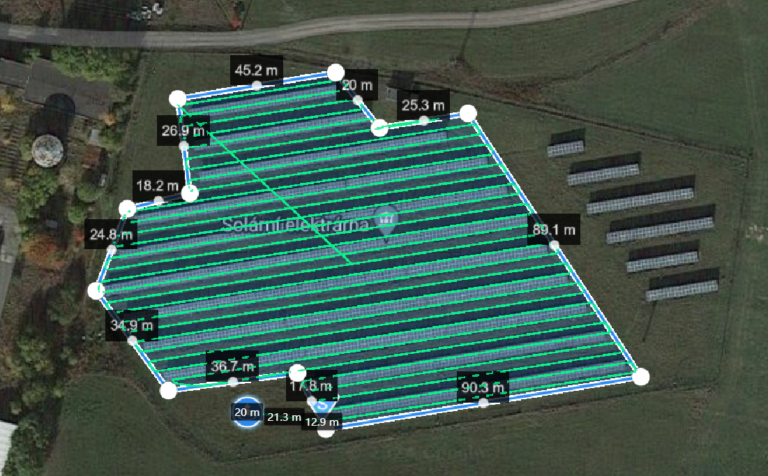
- Flight planning: depending on the character of the location, we will prepare a safe and efficient mission route.
- We will take images in the infrared spectrum in high detail (GSD – Ground Sample Distance, ideally less than 2 cm/pixel).
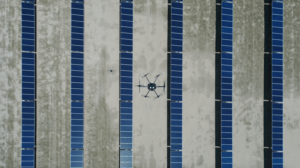
After planning the mission, we arrive at the site where we capture images of the entire PV array in both the visible and infrared spectrum. The client receives information about the start and end of the inspection.
- The pilot is qualified to operate in the A2 subcategory of operation
- UAV (drone) insurance
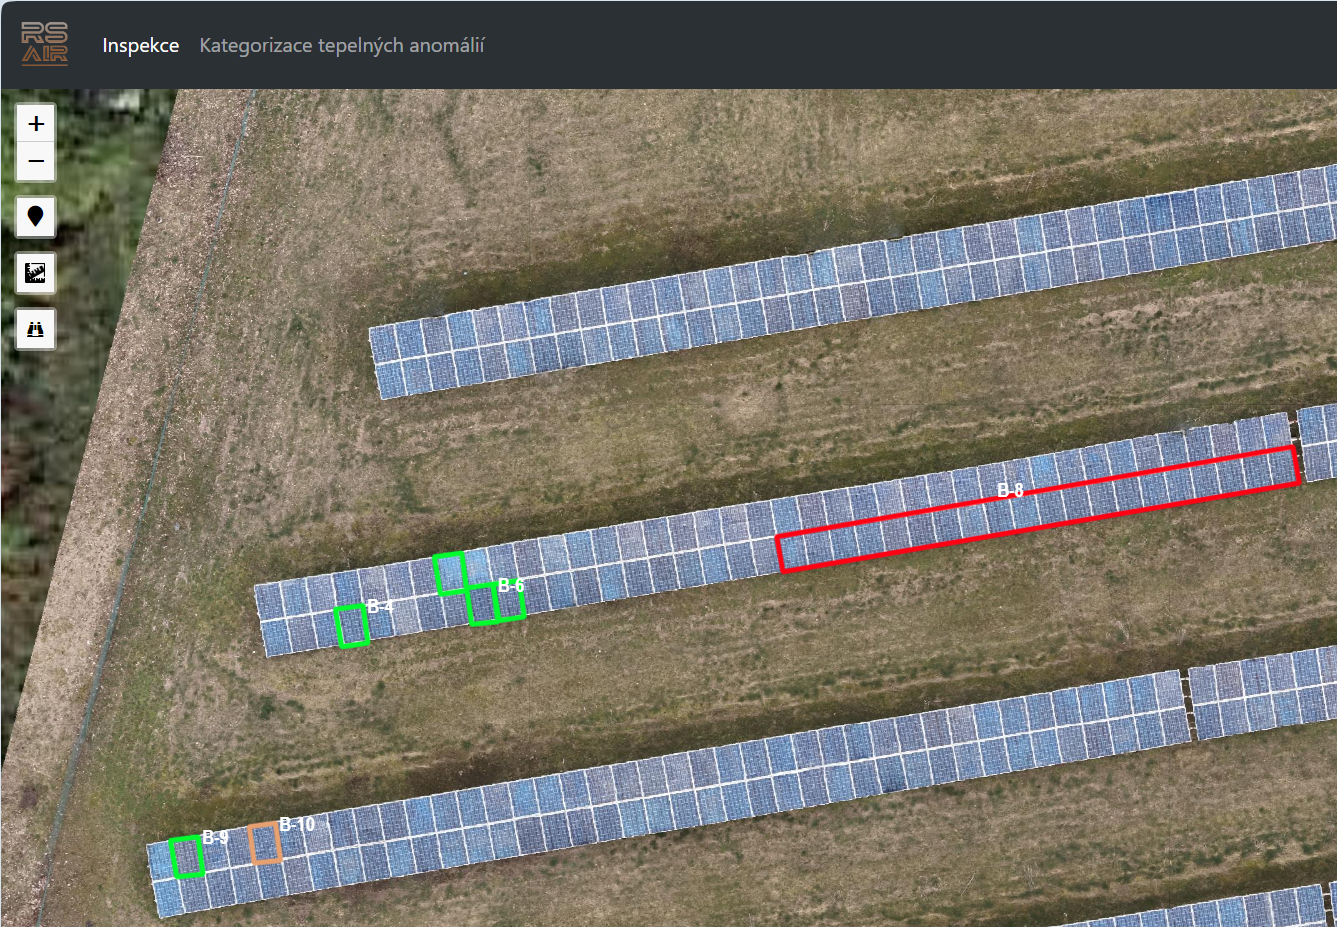
Po provedené inspekci z dat vytvoříme ortofotomapy, díky kterým spolehlivě rozpoznáme tepelné anomálie na rozměrných FVE. Tyto mapy jsou georeferencovány. Díky tomu odpovídají skutečným proporcím zobrazovaných objektů. Na mapách vám vyznačíme nalezené anomálie. Pohodlně je tak lokalizujete přímo na místě s jakýmkoliv chytrým telefonem nebo tabletem v naší aplikaci RSA Inspection Viewer.
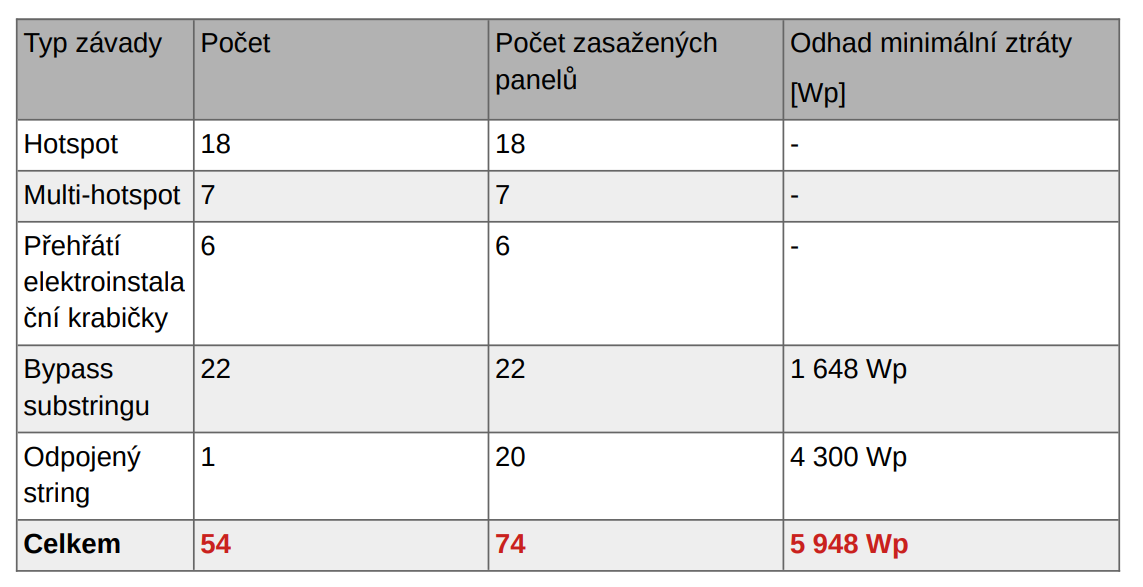
Dále je vypracovaná analýza, ve které se věnujeme jednotlivým anomáliím a odhadujeme ztráty poškozených panelů.
Once the data analysis is complete, we will provide you an interactive map and a document describing in detail the anomalies found with recommendations for their removal. All also available in our RSA Inspection Viewer web application. The data is always available in the application, including previously performed inspections. You can use it, for example, to compare the condition before and after repair or maintenance.
The RS Viewer web application makes the outputs of the inspected PV plants, i.e. interactive map + report, available on all platforms (pc, tablet, smartphone).
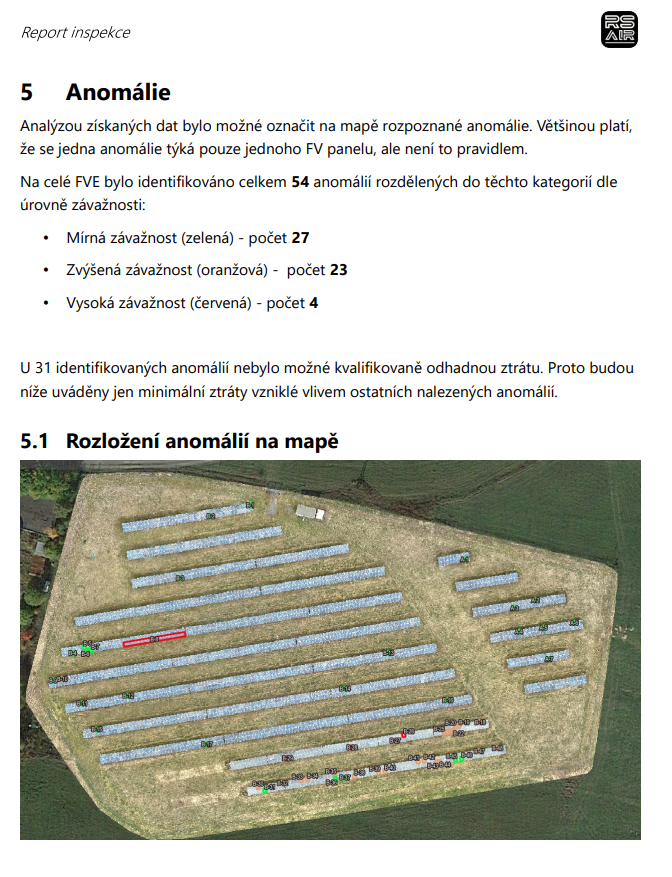
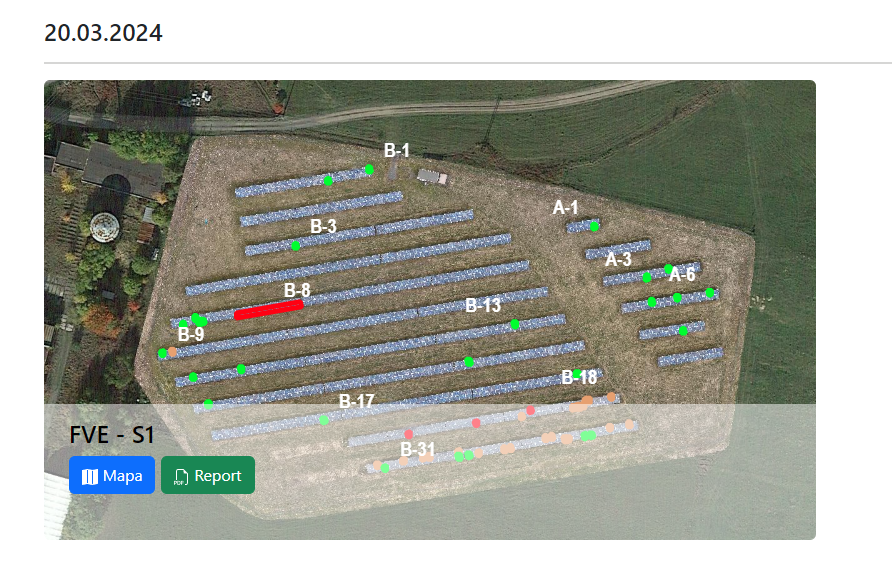
After selecting one of the available inspections, the web application displays an orthophotomap of the power plant in which the PV panels that have been classified as having a thermal anomaly are marked with the following severity levels in terms of PV performance and safety.
- Moderate severity (green) – the impact on plant performance and safety is low. These are most often dirty surfaces or mechanical damage. Monitoring is recommended, can be considered during cleaning.
- Increased severity (orange) – a defect in one panel that can affect the performance of the entire string.
- High severity (red) – a fault identified on multiple panels, typically a failure of the entire string. Recommended to be solved urgently.
The following tools are located in the map window:
- map layer selection
- switching on the current position of the device (suitable for locating a malfunctioning panel on site)
- anomaly finder by identifier
- tool for measuring distances and areas
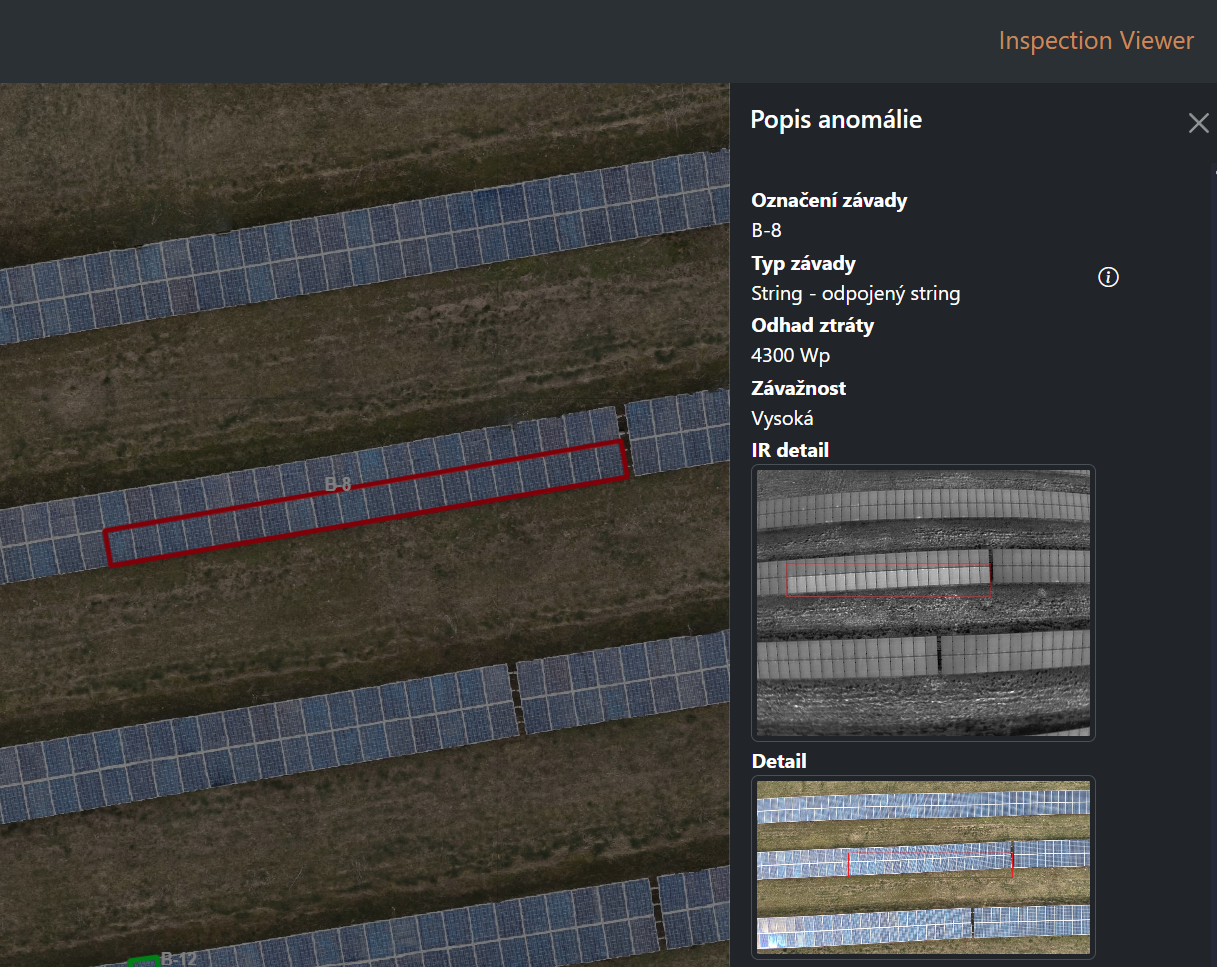
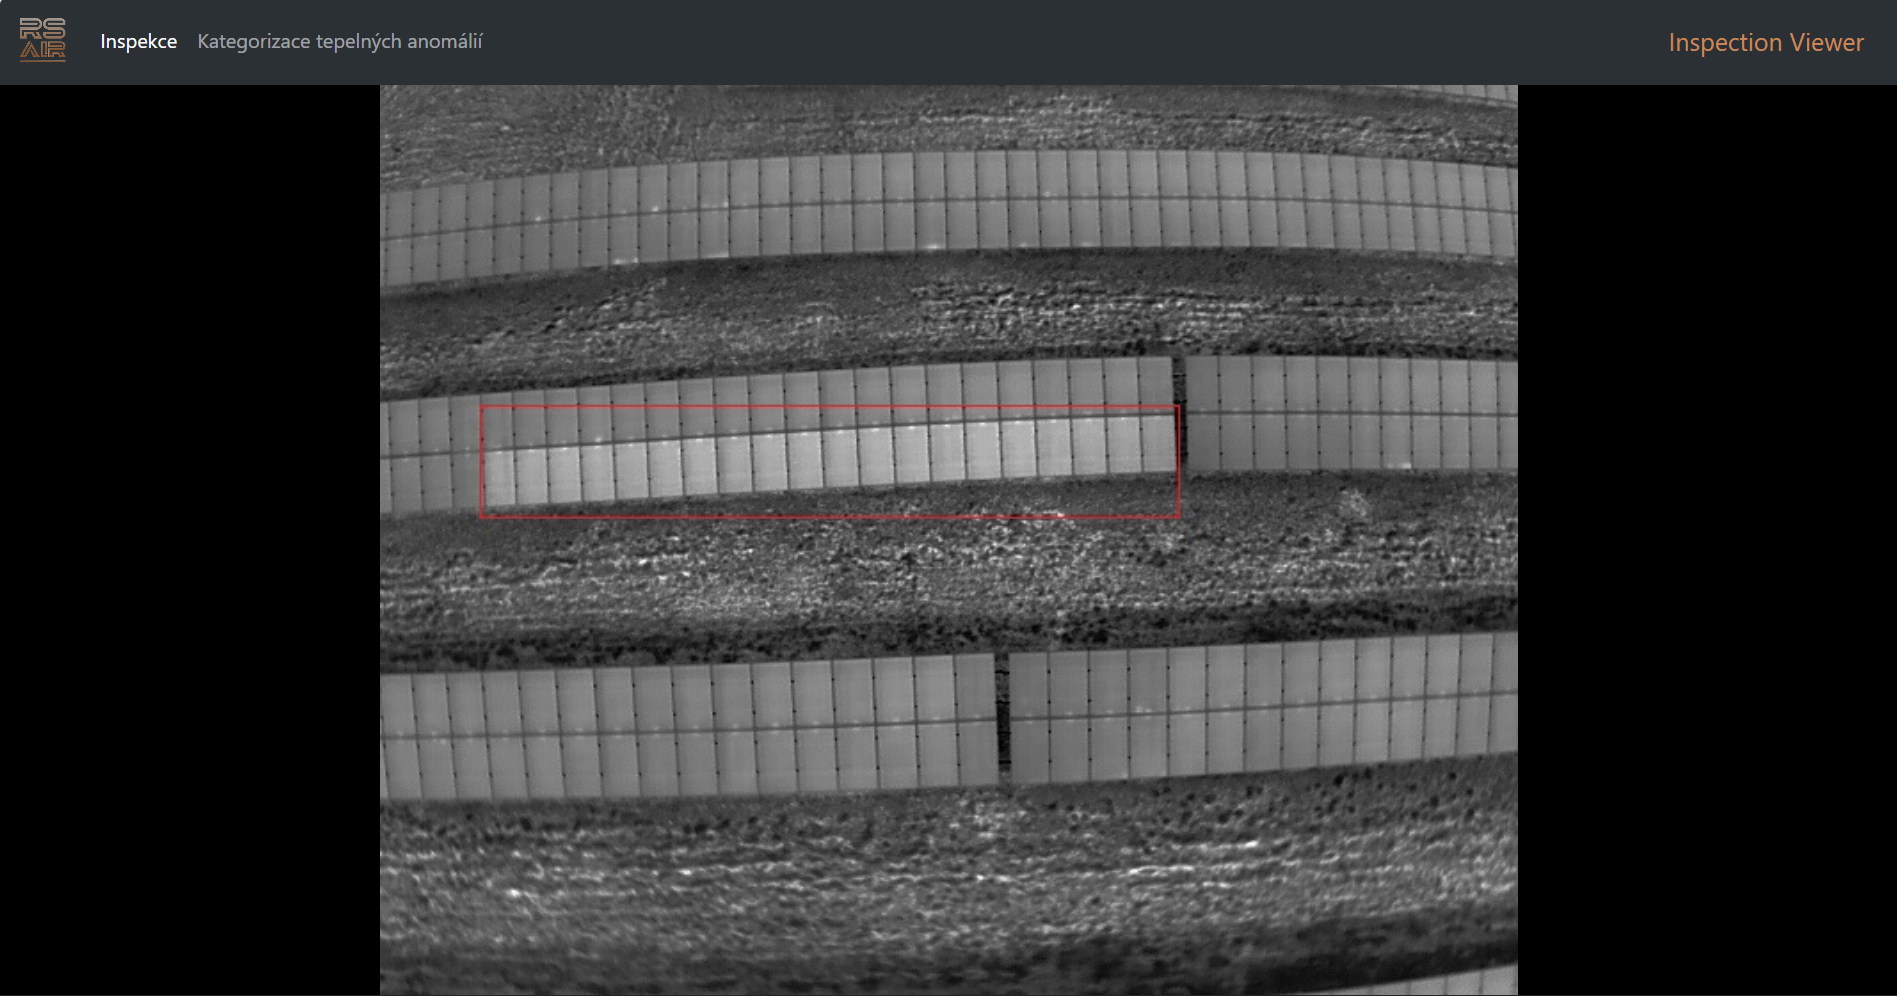
- click on one of the highlighted panels to see the details of the finding, including photos of the panel in the infrared and visible spectrum. These photos can be zoomed in.
The interactive map is easily customisable thanks to its design. This can be practical, for example, in situations where we want to display multiple layers (visible spectrum, infrared spectrum, wiring diagram).